Back to Showcase
Mobile AppLifestyleMaps & Navigation
Lawlessness
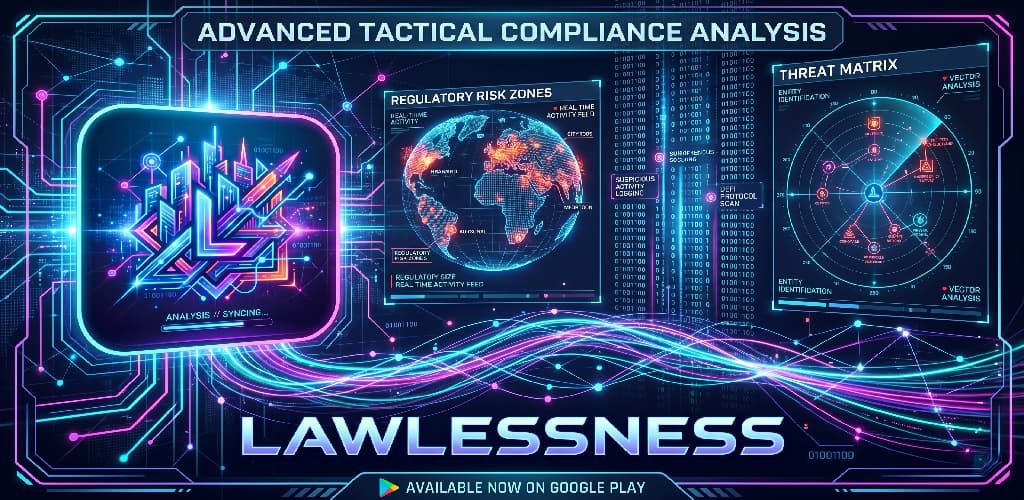
Explore UK crime trends and regional safety metrics with Lawlessness, a data-driven interface built for transparency and situational awareness.
- Released
- November 2018
- Platform
- Android
- Version
- 1.0.0
- Downloads
- 100+
Open Data, Made Readable
UK police forces publish a huge amount of street-level crime data, but in its raw form it is difficult for most people to make sense of. Lawlessness turns that data into something you can actually use, whether you are moving house, planning a trip, or just curious about your own neighbourhood.
Built For Context
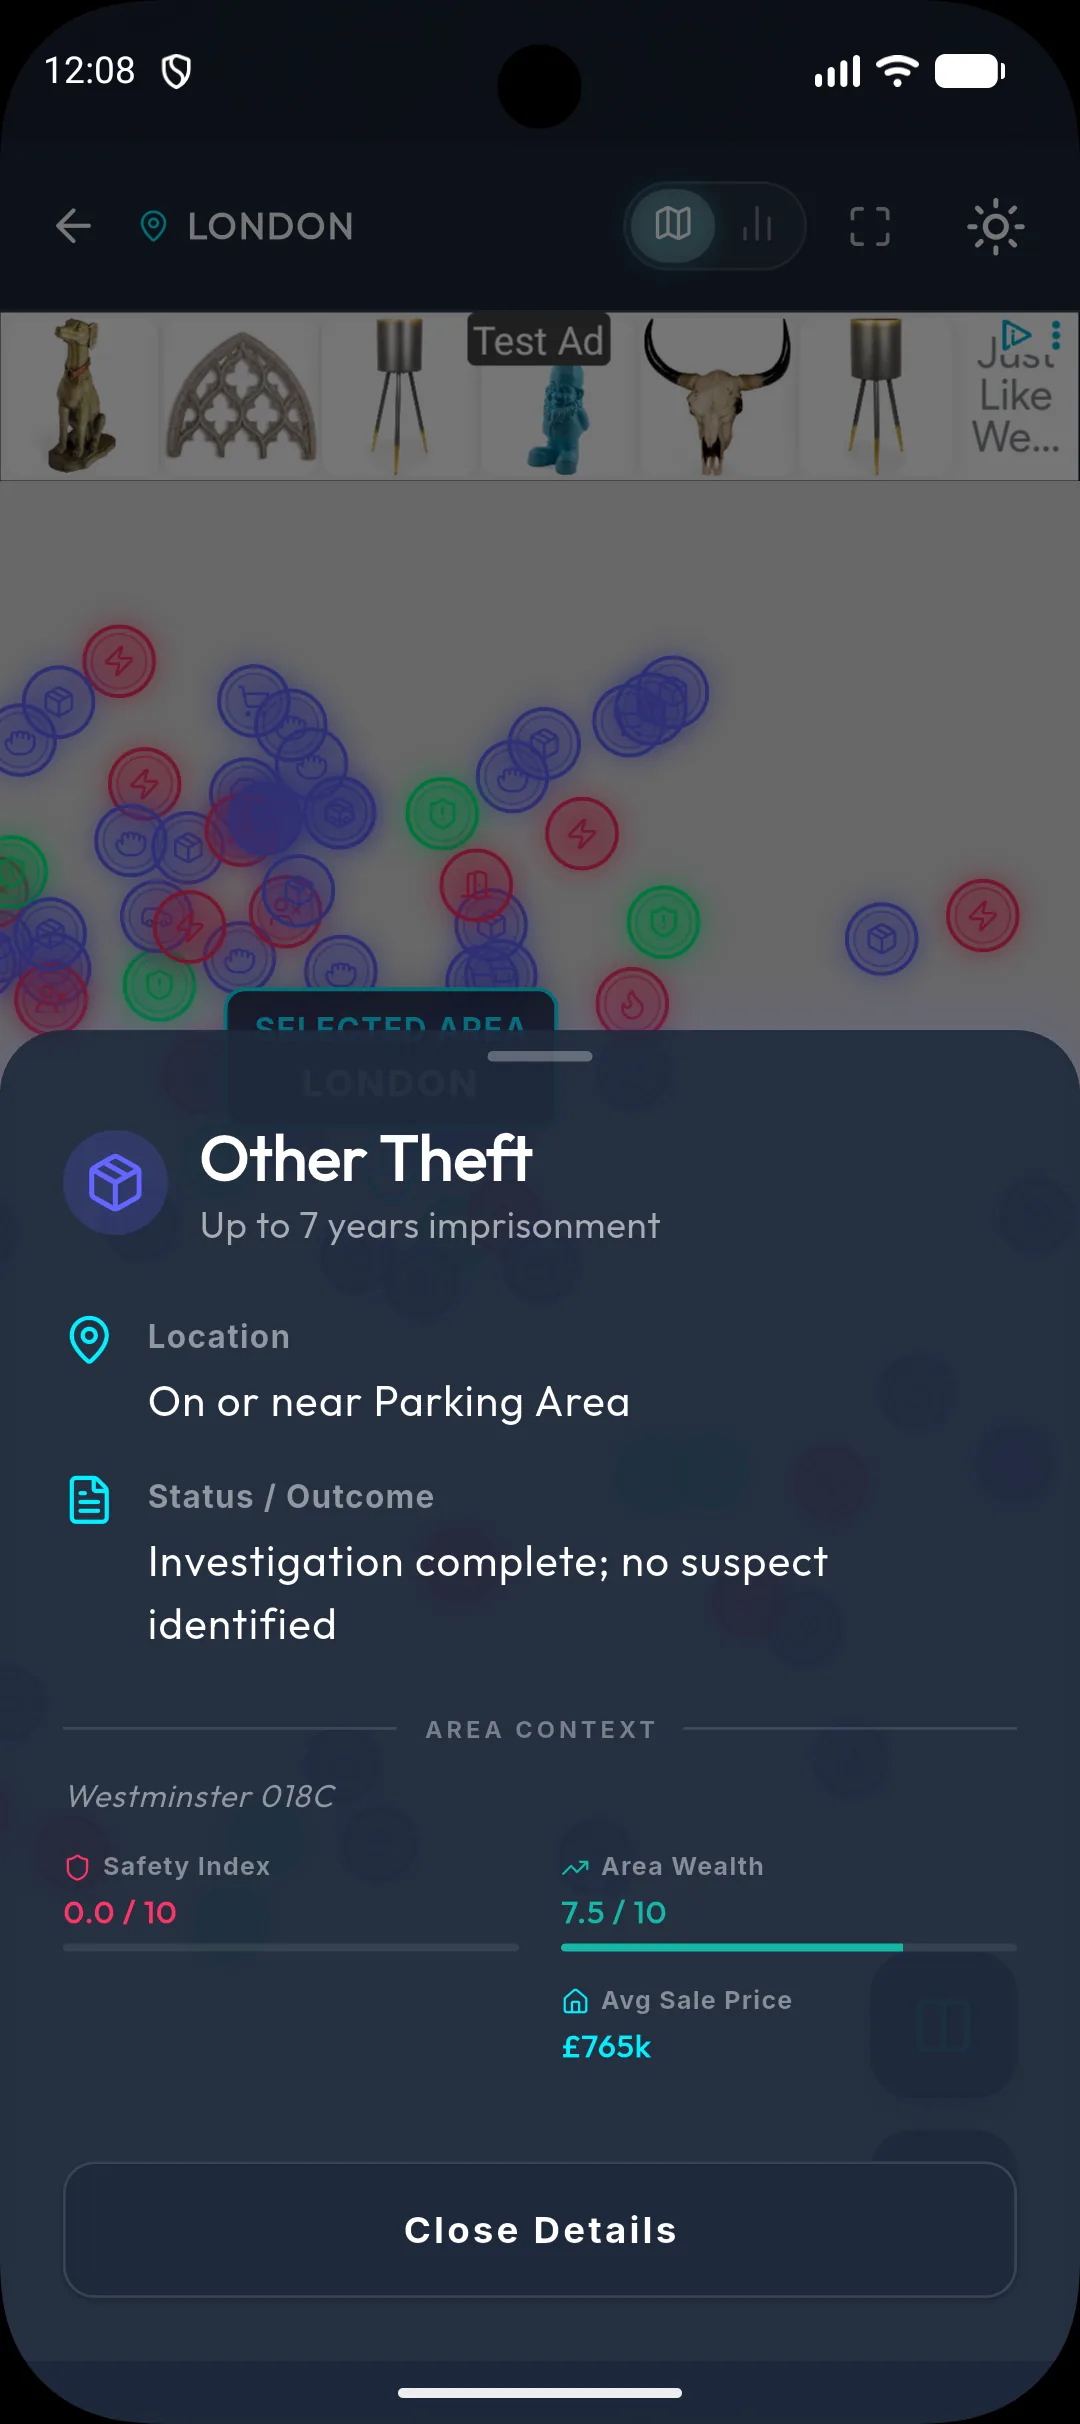
Numbers on their own can be misleading, so Lawlessness focuses on context. You can see an area on the map, compare it against other areas, and get a profile of the kinds of crime that are most common there, all presented through a heads-up display that adapts to what you are looking at.
Key Features
- Adaptive HUD
A heads-up display that reshapes itself around the area and data you are currently viewing.
- Area Comparison
Put two locations side by side to see how their crime levels and trends stack up.
- Interactive Map View
Pan and zoom around the UK to explore crime data geographically.
- Contextual Risk Profile
A breakdown of which types of crime are most prevalent in an area, rather than a single headline number.
Screenshots